


California homeowners have watched two things happen at once. Electricity bills have climbed, sometimes sharply. At the same time, the rate utilities pay for excess rooftop solar sent back to the grid has fallen. That squeeze is the practical effect of NEM 3.0 landing on top of a broader wave of rising utility rates.
This guide explains what NEM 3.0 is in plain language, how it affects Californians today, why it matters for the rest of the country, and what homeowners can do to regain control. The short version: NEM 3.0 changed the math of residential solar in California, and the direction of travel points well beyond state lines.
Key takeaways
- NEM 3.0 (the Net Billing Tariff) took effect for new California solar customers on April 15, 2023, replacing retail-rate net metering [1][3].
- Under NEM 3.0, exported solar is credited at an average of about $0.05 to $0.08 per kWh, down from roughly $0.30 per kWh under NEM 2.0, a cut of about 75 percent [1][3].
- Solar-only cash payback under NEM 3.0 runs approximately 6 to 10 years for investor-owned-utility customers, versus roughly 4 to 5 years under NEM 2.0; adding storage brings payback to about 5 to 7 years with 70 to 90 percent bill offsets [1].
- California's NEM 3.0 survived its final legal challenge in June 2026 when the California Supreme Court declined to hear the appeal, making the tariff definitively in effect [6][7].
- As of 2026, a growing number of U.S. states — more than a dozen active proceedings per SEIA — have reduced, replaced, or are actively revising one-to-one retail net metering [8].
What Is NEM 3.0?
NEM 3.0, formally the Net Billing Tariff, is California's current net metering policy for residential solar, effective April 15, 2023 [3]. It replaced the retail-rate net metering of NEM 1.0 and NEM 2.0 by valuing exported electricity through an hourly avoided-cost framework instead of the retail price. The result: California's NEM 3.0 credits exports at an average of about $0.05 to $0.08 per kWh, roughly 75 percent less than NEM 2.0 [1][3].
Start with the term itself. NEM stands for Net Energy Metering, the policy that governs how a utility pays a residential solar customer for the electricity their system sends back to the grid. Traditional net metering credits that exported power at or near the retail rate, the same price the customer pays to buy electricity, a one-to-one credit.
California has run three versions of this policy. Each one changed the value of a solar export, and each one decided who got grandfathered onto the older, more generous terms.
The three versions of California net metering, side by side. NEM 3.0 is the first version that breaks the one-to-one link between what you sell and what you buy.
| Policy version | Years in effect | Export credit basis | Approx. export value | Who is on it |
|---|---|---|---|---|
| NEM 1.0 | 1995 to early 2010s | Retail rate (one-to-one) | Near retail | Earliest CA solar adopters |
| NEM 2.0 | 2016 to April 2023 | Retail rate plus TOU and small grid-access charges | ~$0.30/kWh [1] | Interconnected 2016 to April 14, 2023; generally grandfathered |
| NEM 3.0 (Net Billing Tariff) | April 15, 2023 to present | Hourly avoided-cost framework | ~$0.05 to $0.08/kWh [1][3] | Interconnected on or after April 15, 2023 |
Here is what changed in practice. Under NEM 3.0, the value of an exported kilowatt-hour is no longer pegged to retail. It is set by an avoided-cost schedule that varies by hour, day, and season. Credits run highest in the late afternoon and evening, when rooftop solar is winding down, and lowest at midday in summer, exactly when most systems export the most.
NEM 3.0 credits exports at an average of about $0.05 to $0.08 per kWh, roughly 75 percent less than the near-retail credit under NEM 2.0.
The policy has also survived its final legal test. In March 2026, the California First District Court of Appeal upheld NEM 3.0 for a second time (Case No. A167721, Mar. 9, 2026). Advocacy groups petitioned the California Supreme Court in April 2026; the Supreme Court declined review in June 2026, making NEM 3.0 definitively in effect with no further judicial avenue [6][7].

How Does NEM 3.0 Impact Californians?
NEM 3.0 affects California homeowners differently depending on one date: when their system was interconnected. Homes interconnected on or before April 14, 2023 are grandfathered under NEM 1.0 or 2.0, generally for 20 years from the interconnection date, so NEM 3.0 is not retroactive [3]. Homes interconnected on or after April 15, 2023 are on NEM 3.0 and have their exports credited at avoided-cost rates [3].
That split creates three distinct groups of Californians, and the right move is different for each one.
Where you stand under NEM 3.0 depends entirely on your interconnection date. Grandfathered homes keep the old math; everyone else has to plan around avoided-cost exports.
| Homeowner segment | Interconnection date | Net metering status | What it means for the home |
|---|---|---|---|
| Grandfathered | On or before April 14, 2023 | NEM 1.0 or 2.0, generally 20 years from interconnection [3] | Export math stays intact; NEM 3.0 is not retroactive |
| On NEM 3.0 | On or after April 15, 2023 | Net Billing Tariff, avoided-cost export credits [3] | Economics depend on self-use, storage, and when exports happen |
| Considering solar now | Future interconnection | NEM 3.0 from day one | Plan for avoided-cost exports; storage changes the payback math [1] |
For homeowners considering solar today, the economics start under NEM 3.0 from the first day. Solar.com marketplace data shows payback for a solar-only cash purchase under NEM 3.0 runs approximately 6 to 10 years for investor-owned-utility customers (with shorter paybacks in high-rate SDG&E territory and longer ones in PG&E and SCE territory), versus roughly 4 to 5 years under NEM 2.0 [1]. Adding storage changes that picture: Solar.com binding-quote data shows roughly 5-to-7-year payback and 70 to 90 percent bill offsets for solar-plus-storage systems [1].
Under NEM 2.0, midday surplus credited near retail and mostly canceled out evening usage. Under NEM 3.0, that surplus is worth a fraction of the evening buy-back price.
The industry felt the change quickly. A November 2023 California Solar and Storage Association member survey projected roughly 17,000 California solar jobs would be lost or eliminated by year-end 2023, approximately 22 percent of the state's solar workforce at the time [9]. Residential install volumes fell, while storage attachment rose sharply [9].
Day to day, the panels still do their job. They produce power and offset midday use just as before. The difference is what happens to the surplus. Under NEM 2.0, midday surplus was credited near retail and largely canceled out evening usage. Under NEM 3.0, that same midday surplus credits at a small fraction of the price you pay to buy power back at night. The hardware did not change. The accounting did.
The Bigger Picture: Why Rate Anxiety Isn't Just About NEM 3.0
Rate anxiety in California is not only about NEM 3.0. Per CPUC filings and the California Public Advocates Office Q1 2026 Electric Rates Report, residential rates at the major investor-owned utilities have risen significantly, with PG&E showing the steepest trajectory [4][10]. Lower export credits and higher import prices moved against solar homeowners at the same time.
The California Public Advocates Office Q1 2026 report tracks residential rate changes across PG&E, SDG&E, and SCE service territories through March 2026 [10]. While specific rate figures in the report reflect Q1 2026 actuals (rather than the 2023-origin forecasts in the Q3 2024 report), the directional picture is consistent: all three utilities have seen meaningful rate increases since NEM 3.0 took effect. Here are the rate forecast figures from the Q3 2024 Public Advocates Office report, which show the scope of the projected climb.
California's three large utilities were all forecast for steep residential rate increases through 2026. PG&E shows both the highest dollar rate and the longest projected climb; verify current actuals against the Q1 2026 report.
| Utility | 2023 rate ($/kWh) | Projected 2026 rate ($/kWh) | Projected increase 2023-2026 | Source |
|---|---|---|---|---|
| PG&E | ~$0.31 | ~$0.44 | ~42% | Public Advocates Office, Q3 2024 [4] |
| SCE | ~$0.29 | ~$0.41 | ~41% | Public Advocates Office, Q3 2024 [4] |
| SDG&E | See Q1 2026 report | See Q1 2026 report | ~22% (Q3 2024 forecast) | Public Advocates Office, Q3 2024; Q1 2026 update [4][10] |
On top of the raw rate increases, the structure of the bill is shifting too. Time-of-use redesigns have pushed peak windows later, typically into the 4 p.m. to 9 p.m. block. Some utilities have added new fixed charges. Wildfire-cost recovery continues to flow through rates [4].
Both sides of the meter moved against the homeowner at once. The imported kWh got more expensive, and the exported kWh got cheaper.
Here is where NEM 3.0's timing problem becomes the real story. A solar home on a standard California TOU rate runs on two clocks that pull in opposite directions:
- Midday (10 a.m. to 3 p.m.) — the sun peaks when grid power is cheap. The hours when the sun is highest and the panels are working hardest are precisely when TOU rates are at their lowest, and when avoided-cost export credits hit their floor.
- Evening (4 p.m. to 9 p.m.) — the panels have nothing left to give. Solar production drops off or stops entirely, and that is exactly when TOU rates spike, grid power gets expensive, and the home starts drawing from the grid at the highest prices of the day.
Under NEM 2.0, the midday surplus had effectively pre-paid for those evening hours, because the export credit tracked retail. Under NEM 3.0, that pre-payment was gutted. The surplus went to the grid at $0.05 to $0.08 per kWh. The evening grid power comes back at $0.30 to $0.44 per kWh or more.
That gap is not just a credit-rate problem. It is a timing problem. Solar's production schedule and the rate schedule have been pulling in opposite directions since April 2023. The lower credit rate makes the headline numbers look bad; the production-to-peak timing mismatch is what actually drives the monthly bill.
For a solar household, the combination is what stings. The electricity you import is more expensive and still rising. The electricity you export is credited lower than it used to be. When both sides of the meter move the wrong way at the same time, you get what people are now calling rate anxiety. It is a rational response to a real shift, not a marketing scare.
What NEM 3.0 Could Mean for the Rest of the Country
NEM 3.0 is not only a California story. As of 2026, a growing number of U.S. states — more than a dozen active proceedings per SEIA — have reduced, replaced, or are actively revising one-to-one retail net metering [8]. Several states have moved toward California's model of lower, time-varying export credits, while others have so far kept retail-rate net metering in place [5].
The shift is uneven, but the pattern is visible. Some states have already adopted net-billing-style structures. Others are mid-debate. A few have pushed back hard.
A growing share of states are drifting toward California's net-billing model, though several still keep retail-rate net metering. Where you live increasingly decides what an exported kilowatt-hour is worth.
| State | Net metering status (2026) | Direction of travel |
|---|---|---|
| California | NEM 3.0 / Net Billing Tariff | Avoided-cost export credits in effect since April 15, 2023 [1][5] |
| Arizona | Net billing, not retail-rate | Export credits below retail, varies by utility [5] |
| Nevada | Credits at 75% of retail (NV Energy new customers) | Tiered credit structure; new customers on Tier 4 at 75% of retail [5][11] |
| Indiana | Net billing, not retail-rate | Transitioning away from retail-rate [5] |
| North Carolina | Duke Energy Bridge Rate open through Dec. 31, 2026 | Bridge Rate closes to new applicants Jan. 1, 2027; new customers move to time-of-use Residential Solar Choice plan [5][13] |
| Georgia | Georgia Power Solar Buy Back program | Avoided-cost rate plus ~4¢/kWh adder, totaling roughly 7.2¢/kWh; implemented 2021 [5][12] |
| Virginia | Full retail-rate net metering preserved | Virginia SCC rejected Dominion Energy's proposal to cut credits (Apr. 30, 2026 ruling); 12-month crediting at retail rate maintained [5][14] |
| Florida | Retail-rate net metering retained for all customers | Legislative attempt to roll back (2022 HB 741) vetoed by Governor DeSantis; full retail-rate credits currently in effect; under periodic legislative pressure but stable as of 2026 [5][15] |
The deciding factor tends to be how a state's utility commission treats the "cost-shift" argument, the claim that retail-rate net metering subsidizes solar households at the expense of non-solar customers. Where commissions accept that framing, they move toward lower, time-varying export credits. Where they reject it, retail-rate net metering survives longer [5].
For a 20-to-25-year solar investment, the prudent planning assumption is that many states will move in NEM 3.0's direction at some point.
Nevada offers a useful case study in graduated rollback. NV Energy's net metering program now credits new customers at 75 percent of the retail rate (Tier 4), while earlier cohorts retain higher credit tiers from 95 percent down to 81 percent depending on enrollment date — each locked in for 20 years [11]. It is not full retail-rate, but it is also not the avoided-cost floor that California adopted.
Georgia took a different path. Georgia Power's Solar Buy Back program was already implemented by 2021, crediting exported solar at Georgia Power's avoided-energy cost plus a Public Service Commission-approved 4¢/kWh adder, for a combined rate of roughly 7.2¢/kWh [12]. Customers maximize value by consuming solar on-site first, since exports receive substantially less than what they pay to buy power at retail.
North Carolina is at an inflection point. Duke Energy's Net Metering Bridge Rate, which offers more favorable export compensation than what comes next, closes to new applicants on December 31, 2026. Starting January 1, 2027, new solar customers in Duke territory face the Residential Solar Choice plan with time-of-use Critical Peak Pricing — a structure that pushes daytime export values down and evening import costs up in ways that echo the NEM 3.0 dynamic [13].
Virginia, by contrast, held the line. On April 30, 2026, the Virginia SCC rejected Dominion Energy's proposal to cut solar export credits by 32% (from roughly $0.14/kWh to $0.095/kWh), preserving full retail-rate net metering on a 12-month crediting cycle [14]. Utilities continue to challenge net metering economics, but Virginia regulators have held so far.
This is not a doom forecast. Solar still produces real value. What is changing is the architecture that captures that value, from "produce and export at retail" toward "produce, store, and use at the right time." Storage attachment rises in every market making this transition [5]. The home battery is becoming the standard answer wherever export credits fall.

Fighting Back With a Home Battery Under NEM 3.0
Interactive
The same kWh, re-priced by the clock
Under NEM 3.0, midday surplus exports for pennies but evening power buys back for far more. See what a battery captures by storing that surplus instead of selling it.
Illustrative estimate, not a guaranteed saving. Rates are the round numbers used in this post: NEM 3.0 midday avoided-cost export credit ≈ $0.08/kWh; PG&E TOU on-peak (4–9 p.m.) buy-back ≈ $0.30–$0.44/kWh [1][4]. Annual figure assumes the modeled spread holds 365 days; real outcomes vary with system size, usage, season, battery round-trip losses, and your rate plan. Battery self-consumption value = surplus kWh × (your peak rate − export rate). Kora Energy Trading (selling spare power back to the grid) is planned and still in development — not a current earnings source.
So how do you take back the value NEM 3.0 moved?
A home battery paired with intelligent control is the most concrete tool for reducing exposure to changing rates and net metering rules. The reason is mechanical, not promotional: under NEM 3.0, the value of each kilowatt-hour depends heavily on when it is produced or used, and a battery plus a smart panel makes those timing decisions automatically [1]. Storage lets a home use its own solar instead of exporting it at a low credit.
A battery stores energy. Control makes it usable at the right moment. Pair the two and storage plus control can do four things that directly answer the NEM 3.0 squeeze:
- Self-consume solar instead of exporting at a low credit, capturing the spread between the avoided-cost export rate and the retail buy-back price [1].
- Shift load to off-peak, charging overnight or during low-cost midday hours and discharging during the 4 p.m. to 9 p.m. peak window [4].
- Reduce exposure to further rate changes, because a home that consumes most of its own electricity has less of its bill riding on volatile import and export rates.
- Keep critical loads running during outages, so backup is part of the same system rather than a separate purchase.
Solar created the power. Control determines who captures the value.
Here is a concrete example of how that plays out. Consider a San Jose homeowner on PG&E's TOU-C rate, with a 7 kW panel system that produces about 30 kWh on a typical summer weekday and total household consumption of about 25 kWh per day. The same energy gets re-priced by the clock — and a battery rewrites the result:
- Solar only — midday surplus. The home self-consumes roughly 20 to 25 kWh during the day when solar is producing, but the 5 kWh surplus exports to the grid at the NEM 3.0 midday avoided-cost rate — call it $0.08/kWh. That earns about $0.40 in export credits.
- Solar only — evening buy-back. By 5 p.m., the panels are done but the evening appliances, the HVAC, the dishwasher, the EV charger are just getting started. The home buys those evening kilowatt-hours back from PG&E at the on-peak TOU rate, which can reach $0.44/kWh or more. The net result: the midday surplus earns 8 cents, and the evening demand costs 44 cents or more per kWh.
- With a 10 kWh battery — capture the surplus. Instead of exporting that 5 kWh surplus at $0.08, the battery captures it for later use.
- With a 10 kWh battery — discharge at peak. During the 5 p.m. to 9 p.m. peak window, the battery discharges 7 kWh or more to cover evening loads that would otherwise cost $0.44/kWh to import. The spread between what it would have cost to import and what it cost to store is roughly $0.36 per kWh.
- The daily difference. Across 7 kWh of discharged storage, that is about $2.50 in avoided peak charges per day — versus the $0.40 in export credits the solar-only home collected.
That example uses round numbers anchored to the rate figures cited in this post [1][4], and actual outcomes vary by system size, usage pattern, and rate plan. But the direction of the math is consistent across markets wherever the production-to-peak timing gap exists.
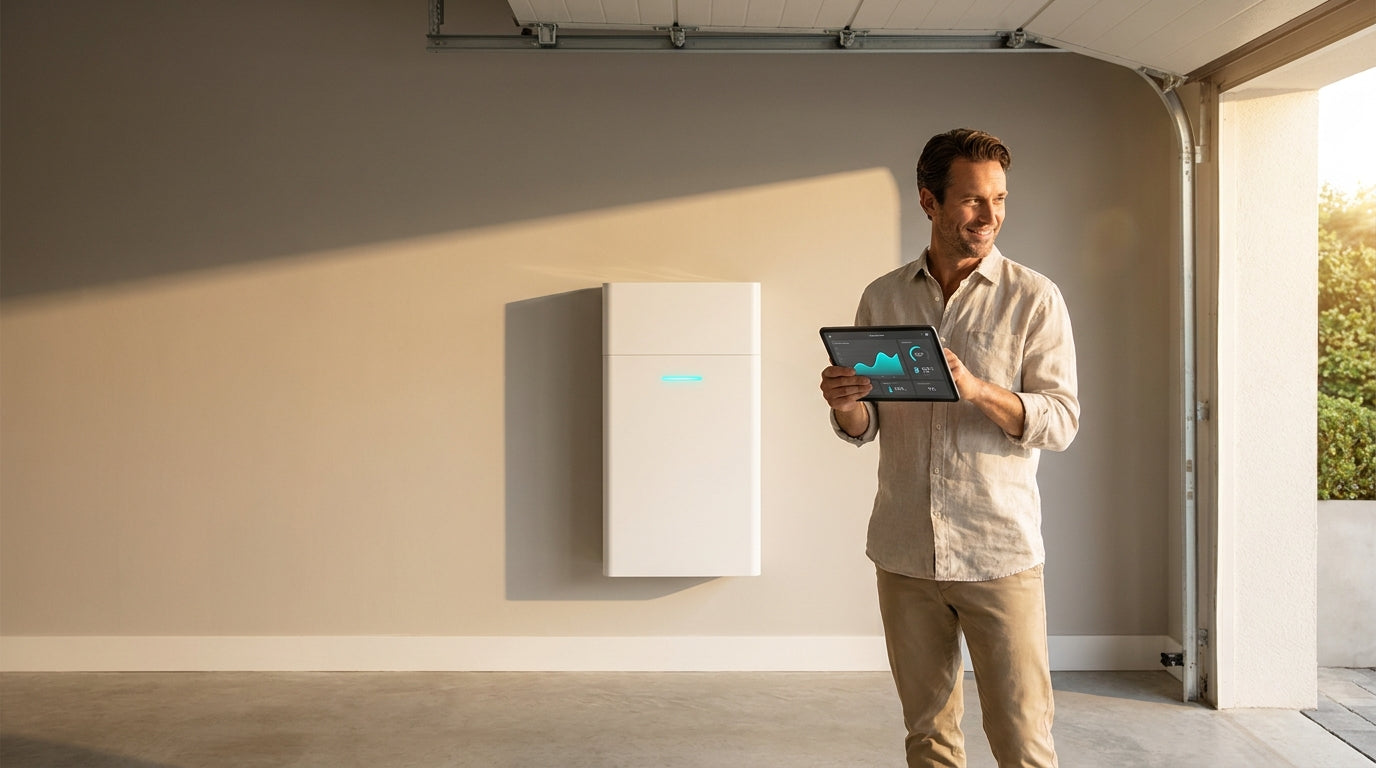
This is where the Kora Founders Edition fits. It packages a Kora Smart Panel (load monitoring and control across up to 12 home circuits), Powerblocks (modular LFP storage that scales from an 8 kWh single tower up to 112 kWh across four towers), and the Kora Power App into one integrated home energy system. The Smart Panel runs operating modes including Self-Power, Time of Use, Backup Standby, and Mandatory. It is designed to consume solar first, store the surplus, discharge when solar is insufficient, and prioritize peak-window discharge under time-of-use rates.
Kora is one of several systems that can do this work, and Kora Energy Trading, the planned layer for selling spare power back to the grid, is still in development rather than something customers earn from today. The point is simpler and bigger than any one brand: the technology to respond to NEM 3.0 exists, and it is increasingly accessible. Always have a licensed electrician evaluate your home's wiring, panel, and solar setup before adding storage; whole-home versus partial-home backup depends on a site-specific load analysis.
A solar-only system and a solar-plus-storage system now produce very different outcomes under NEM 3.0. The table below shows why so many California buyers are adding a battery from the start.
Adding storage roughly halves the payback period under NEM 3.0 and lifts bill offsets to 70 to 90 percent. The battery, not the panel, is what recovers most of the value NEM 3.0 took away.
| Configuration | Net metering era | Typical cash payback | Bill offset |
|---|---|---|---|
| Solar only | NEM 2.0 | Roughly 4 to 5 years [1] | High (near one-to-one credits) |
| Solar only | NEM 3.0 | Approximately 6 to 10 years [1] | Reduced (avoided-cost exports) |
| Solar plus storage | NEM 3.0 | ~5 to 7 years [1] | 70 to 90 percent [1] |

See what the Kora 4-in-1 system could do for your home → Reserve your Founders Edition (korapower.com/products/founders-edition). No guaranteed savings; actual results depend on your rates, usage, and site.
Frequently Asked Questions
What is NEM 3.0 in simple terms?
NEM 3.0, the Net Billing Tariff, is California's current net metering policy for residential solar, effective April 15, 2023, replacing the retail-rate net metering of NEM 1.0 and 2.0 [3]. Under NEM 3.0, exported electricity is credited at hourly avoided-cost rates rather than retail, averaging about 75 percent less than NEM 2.0 credits [1][3].
Does NEM 3.0 apply to existing solar customers?
No. Under NEM 3.0, customers interconnected on or before April 14, 2023 are grandfathered under NEM 1.0 or 2.0, generally for 20 years from their original interconnection date [3]. NEM 3.0 applies only to systems interconnected on or after April 15, 2023, so the change is not retroactive for earlier solar homes [3].
How much have California electricity rates gone up?
Per CPUC and California Public Advocates Office data, PG&E, SCE, and SDG&E residential rates have risen substantially since 2023, with PG&E showing the steepest trajectory [4][10]. The Q3 2024 Public Advocates Office forecast projected roughly 42 percent for PG&E and 41 percent for SCE from 2023 to 2026; the Q1 2026 report tracks actual rate changes through March 2026 and should be consulted for current figures [4][10].
Will other states adopt NEM 3.0-style rules?
Many already have or are moving that way. As of 2026, a growing number of U.S. states have reduced, replaced, or are revising retail-rate net metering, with Arizona, Nevada, Indiana, North Carolina, and Georgia among those already operating below retail-rate credits, while Virginia and Florida have preserved retail-rate net metering so far [5][8]. Storage attachment rises in every transitioning market [5].
Is solar still worth it under NEM 3.0?
Solar still yields a positive long-term return for most California households, but solar-only cash payback moved from roughly 4 to 5 years under NEM 2.0 to approximately 6 to 10 years under NEM 3.0 for investor-owned-utility customers, per Solar.com marketplace data [1]. Adding a battery brings payback to roughly 5 to 7 years with 70 to 90 percent bill offsets [1].
How does a home battery help under NEM 3.0?
Under NEM 3.0, a home battery lets the home use its own solar instead of exporting it at the lower avoided-cost rate, and discharges stored energy during high-cost peaks to avoid expensive grid power [1]. Paired with a smart panel, a battery automates these timing decisions across circuits. Consult a licensed electrician before installing storage.
No One-Size-Fits-All Answer
NEM 3.0 did not end the case for rooftop solar in California. It changed where the value lives, from exporting power at retail to producing, storing, and using it at the right time. Your own situation depends on your interconnection date, your rate plan, your usage pattern, and whether you pair panels with storage. The same logic increasingly applies wherever export credits are falling.
Timing and control now matter as much as generation. The home that knows when power is cheap is the home that captures the value NEM 3.0 redistributed.
If there is one durable takeaway, it is that timing and control now matter as much as generation. The home that knows when power is cheap, when it is expensive, and which loads matter is the home that captures the value NEM 3.0 redistributed.
Find out how much battery your home actually needs.
References
- Solar.com. "NEM 3.0 Proposal and Impacts for California Homeowners." https://www.solar.com/learn/nem-3-0-proposal-and-impacts-for-california-homeowners/ (export credit values, solar-only and solar-plus-storage payback periods, bill offsets). Verified 2026-06-25. ↩
- CPUC. "Net Billing Tariff (NEM 3.0)." https://www.cpuc.ca.gov/industries-and-topics/electrical-energy/demand-side-management/customer-generation/net-energy-metering-and-net-billing (primary CPUC source for NEM 3.0 tariff terms and effective date). Verified 2026-06-25. ↩
- EnergySage. "Net Metering 3.0: A Guide to NEM 3.0." https://www.energysage.com/blog/net-metering-3-0/ (export credit comparisons, effective date, grandfathering, market analysis). Verified 2026-06-25. ↩
- California Public Advocates Office. "Q3 2024 Electric Rates Report" (Dec. 5, 2024). https://www.publicadvocates.cpuc.ca.gov/-/media/cal-advocates-website/files/press-room/reports-and-analyses/241205-public-advocates-office-q3-2024-rates-report.pdf (PG&E, SCE, SDG&E rate forecasts through 2026). Verified-pending 2026-06-25. ↩
- The GreenWatt. "Net Metering by State 2026." https://www.thegreenwatt.com/net-metering-by-state/ (state-by-state net metering status). Verified 2026-06-25. ↩
- PV Magazine USA. "California court upholds NEM 3.0, dealing blow to rooftop solar" (Mar. 10, 2026). https://pv-magazine-usa.com/2026/03/10/california-court-upholds-nem-3-0-dealing-blow-to-rooftop-solar/ (March 2026 appellate ruling, Case No. A167721). Verified 2026-06-25. ↩
- PV Tech. "Advocacy groups petition California Supreme Court over NEM 3." https://www.pv-tech.org/advocacy-groups-petition-california-supreme-court-over-nem-3/ (April 2026 Supreme Court petition; Solar Rights Alliance confirms Supreme Court declined review June 2026). Verified 2026-06-25. ↩
- SEIA. "Net Metering." https://www.seia.org/net-metering/ (overview of net metering proceedings across U.S. states). Verified 2026-06-25. ↩
- California Solar and Storage Association (CALSSA). "Massive Layoffs, Business Closures and Loss of Clean Energy Progress Since CPUC Slashed Rooftop Solar Incentives." Nov. 30, 2023. https://calssa.org/press-releases/2023/11/30/massive-layoffs-business-closures-and-loss-of-clean-energy-progress-since-cpuc-slashed-rooftop-solar-incentives-new-analysis-shows (member survey projecting ~17,000 California solar jobs lost or eliminated by end of 2023, approximately 22% of state workforce). Verified 2026-06-25. ↩
- California Public Advocates Office. "Q1 2026 Electric Rates Report." https://www.publicadvocates.cpuc.ca.gov/press-room/reports-and-analyses/2026-q1-electric-rates-report (residential rate changes across PG&E, SDG&E, and SCE through March 2026). Verified 2026-06-25. ↩
- EnergySage. "NV Energy Net Metering." https://www.energysage.com/local-data/net-metering/nv-energy/ (NV Energy tiered credit structure; new customers at 75% of retail, Tier 4; 20-year credit lock-in). Verified 2026-06-25. ↩
- EnergySage. "Georgia Power Net Metering." https://www.energysage.com/local-data/net-metering/georgia-power/ (Georgia Power Solar Buy Back; avoided-energy cost plus ~4¢/kWh PSC adder totaling ~7.2¢/kWh). Verified 2026-06-25. ↩
- NC Solar Now. "Duke Energy Net Metering Bridge Rate Deadline." https://ncsolarnow.com/blog/duke-energy-net-metering-bridge-rate-deadline/ (Bridge Rate closes Dec. 31, 2026; new applicants after Jan. 1, 2027 move to Residential Solar Choice TOU plan). Verified 2026-06-25. ↩
- Solar United Neighbors. "Solar wins! Dominion Energy's net metering proposal shot down in Virginia." https://solarunitedneighbors.org/news/net-metering-win-in-virginia/ (Virginia SCC Apr. 30, 2026 ruling; rejected 32% credit cut; preserved 12-month crediting at retail rate). Verified 2026-06-25. ↩
- EnergySage. "Florida Net Metering: House Bill 741." https://www.energysage.com/blog/florida-net-metering-house-bill-741/ (HB 741 passed legislature but vetoed by Governor DeSantis Apr. 27, 2022; retail-rate net metering retained for all Florida customers). Verified 2026-06-25. ↩



Share:
Why Is the US Power Grid So Fragile? The 2026 Structural Reality
Will the Grid Hold This Summer? A 2026 Heat-Season Home Battery Prep Guide